I’ve noticed a memory leak in the openiap/openflow:1.5.12.64 image. It starts at 240MB but keeps growing and never frees up memory.
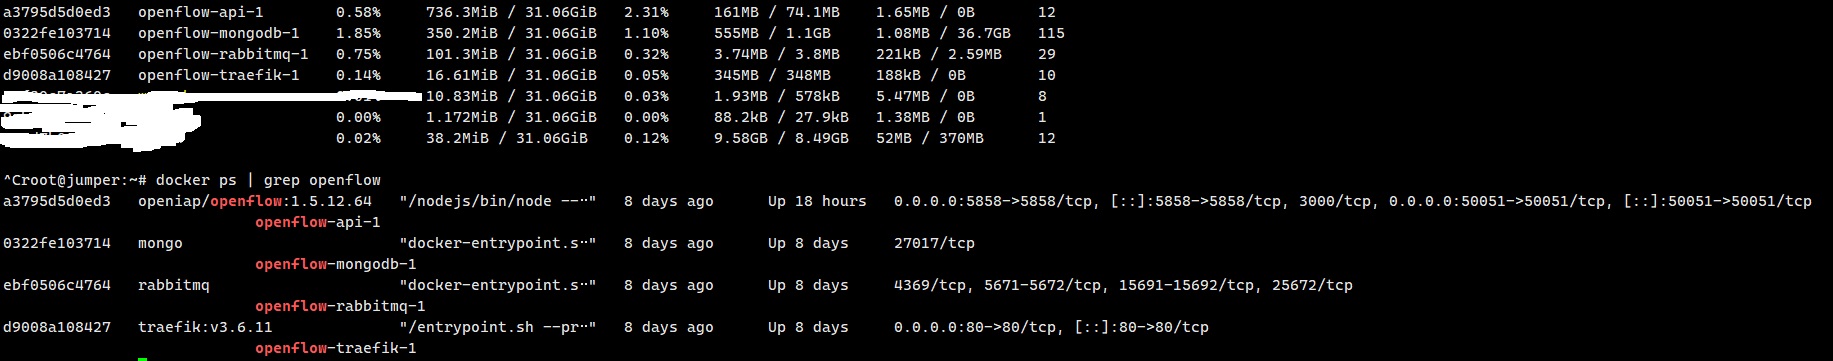
To test this, I only deployed one hdbot client. The container memory grows by over 500MB daily. After running for about two weeks, it hit 7.8GB. I had to restart the container to drop the usage back down to the initial 240MB.
I do not doubt for a second that it could happen, but I need more than “it memory leaks.” What are you doing? Are you uploading large files? How many clients do you have? What is the usage pattern?
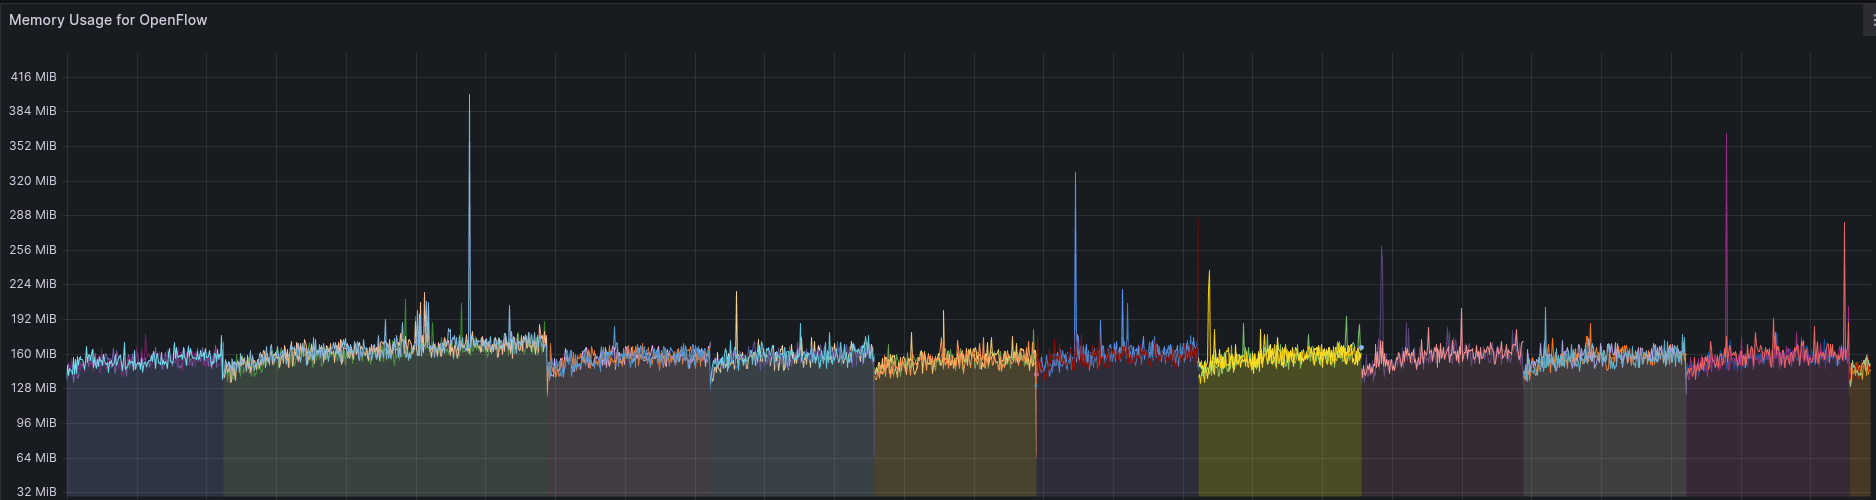
This is the memory usage over the last 90 days from app.openiap.io, which also uses 1.5.12.64 since it was released, and has between 300 and 950 users connected at all times, and I do not see the same pattern. So my first guess is you have some kind of abnormal usage pattern that we need to track down first.
One thing that “killed” high memory spikes for me was setting max_memory_aggregate_mb and max_memory_query_mb to 5. Maybe give that a try.
I just followed the Docker guide on GitHub to do a trial run of OpenFlow to learn how it works locally. I didn’t use it for any heavy lifting, like uploading files.
Basically, I installed OpenRPA on Windows 10 and connected it to my local OpenFlow service via WebSocket. I haven’t configured OpenFlow yet, so the max_memory_aggregate_mb and max_memory_query_mb settings are currently at their defaults. I’ll give those a try and see what happens—maybe the lack of settings is the root cause of the problem.
Thanks again for the help. It’s a really great tool!
Glad it worked, but you also said it increased over time, so keep an eye on it for a few days.