Hello,
I have installed Openflow on kubernetes via Helm (following the instructions in the link openflow | Scalable, secure workflow solution).
I used an external MongoDB and configured it in the values.yaml. As follows:
domainsuffix: <domainsuffix> # this will be added to all domain names
domain: <domain>
openflow:
image: openiap/openflow
license_key:
external_mongodb_url: mongodb://adminuser:<password>@mongo-nodeport-svc:27017
auto_create_users: false
mongodb_db: admin
livenessProbe:
enabled: false
readinessProbe:
enabled: false
startupProbe:
enabled: false
supports_watch: false# Use colors in console log log_with_colors: true # log when adding, updating, removing or clearing cache items log_cache: true # Log verbose and higher events related to login provider log_login_provider: true # Log verbose and higher websocket events log_websocket: true # Log verbose and higher oauth provider events log_oauth: true # Log verbose and higher webserver events log_webserver: true # Log verbose and higher database events log_database: true # Log verbose and higher grafana events log_grafana: true # Log verbose and higher events around house keeping log_housekeeping: true # Log verbose and higher open telemtry registration events log_otel: true # Log everytime a blocked ip connection is dropped log_blocked_ips: true # Enable logging of all information events log_information: true # Enable logging of all debug events log_debug: true # Enable logging of all verbose events log_verbose: true # Enable logging of all silly events log_silly: truerabbitmq:
default_pass: supersecret
mongodb:
enabled: false
Openflow is deployed correctly and running, it connects to MongoDB and RabbitMQ with no issues, sometimes it takes a couple of restarts to connect to RabbitMQ.
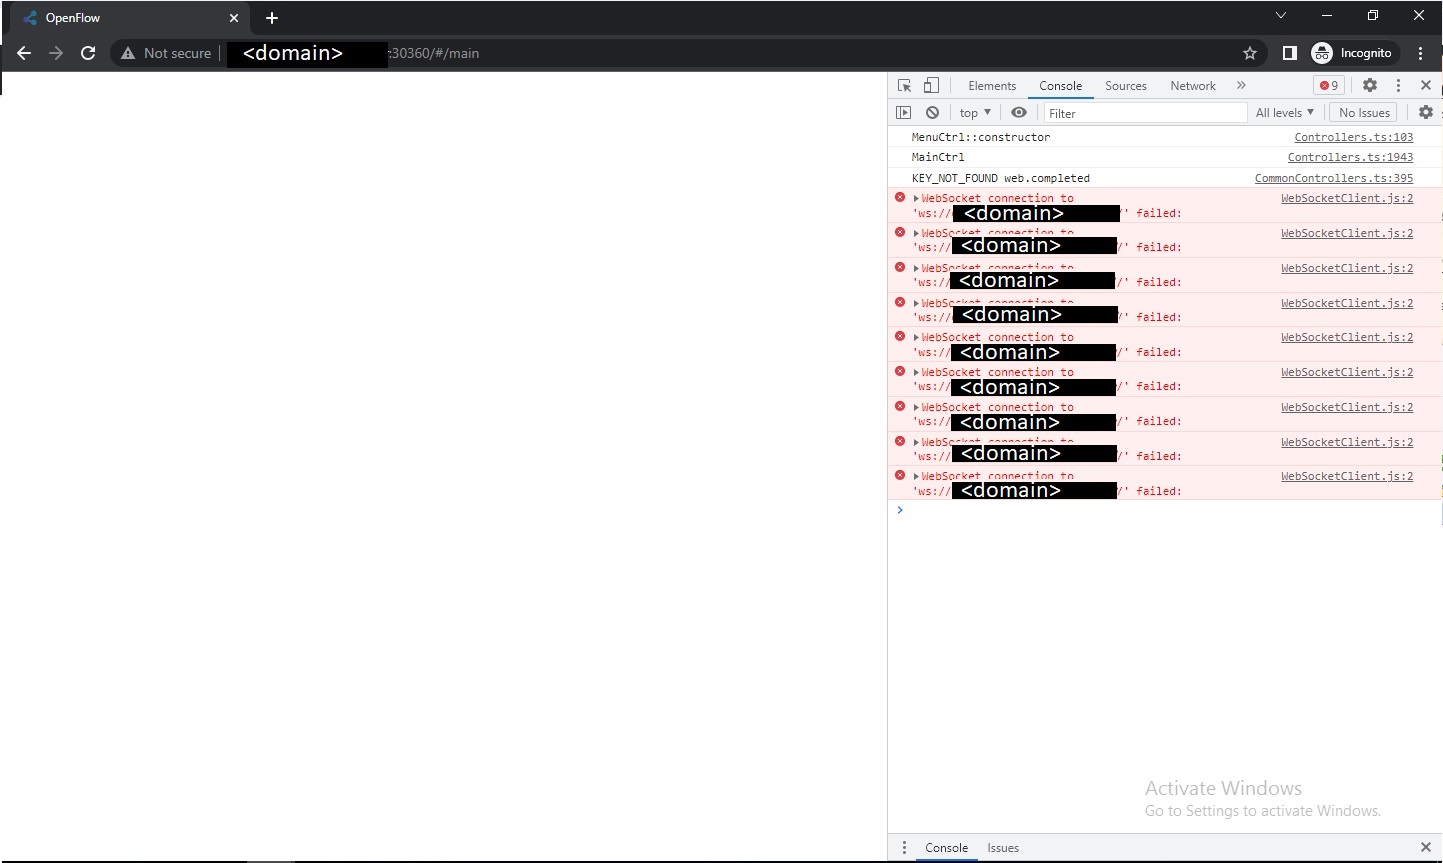
However, when I try to access Openflow via browser, the screen just get blank and looking at the browser’s console, it gives an error message: “WebSocketClient.js:2 WebSocket connection to ‘ws:///’ failed”. As shown in the image below:
I have captured the openflow pod description and kubernetes services (for port fowarding purposes):
(I have added some backslashes to remove unwanted links)
Name: api-5bc6c74985-n8pp9
Namespace: default
Priority: 0
Service Account: openflow-api-user
Node: /10.192.12.121
Start Time: Wed, 01 Mar 2023 13:44:06 -0300
Labels: pod-template-hash=5bc6c74985
role=api
Annotations: \cni.projectcalico.org/containerID: 184a765e3234cf7f947e753a0f8d6b33ab13ac319efd8c631026287b2260132c
\cni.projectcalico.org/podIP: 192.168.129.97/32
\cni.projectcalico.org/podIPs: 192.168.129.97/32
\prometheus.io/port: 3000
\prometheus.io/scrape: true
Status: Running
IP: 192.168.129.97
IPs:
IP: 192.168.129.97
Controlled By: ReplicaSet/api-5bc6c74985
Containers:
api:
Container ID: containerd://3a9597df36907648178a4a358c0fb2cd819d4f3bcc6b8625a6bba13fa93f184e
Image: openiap/openflow
Image ID: \docker.io/openiap/openflow@sha256:9752be069d882dac7f461dc74eb08709812ad3cc2a0734e12abd46cff4ee98e9
Ports: 3000/TCP, 5858/TCP
Host Ports: 0/TCP, 0/TCP
State: Running
Started: Wed, 01 Mar 2023 13:44:08 -0300
Ready: True
Restart Count: 0
Environment:
heapdump_onstop: false
getting_started_url: \https://skadefro.github.io/openrpa.dk/gettingstarted.html
otel_trace_dashboardauth:
otel_trace_pingclients:
otel_trace_include_query:
otel_trace_connection_ips:
otel_trace_mongodb_per_users:
otel_trace_mongodb_query_per_users:
otel_trace_mongodb_aggregate_per_users:
otel_trace_mongodb_insert_per_users:
otel_trace_mongodb_update_per_users:
otel_trace_mongodb_delete_per_users:
socket_rate_limit:
socket_rate_limit_points:
socket_rate_limit_duration:
socket_rate_limit_points_disconnect:
client_heartbeat_timeout:
client_signin_timeout:
api_rate_limit:
api_rate_limit_points:
api_rate_limit_duration:
supports_watch: false
log_with_colors: true
log_cache: true
log_amqp:
log_login_provider: true
log_websocket: true
log_oauth: true
log_webserver: true
log_database: true
log_grafana: true
log_housekeeping: true
log_otel: true
log_blocked_ips: true
log_information: true
log_debug: true
log_verbose: true
log_silly: true
log_to_exchange:
validate_emails:
forgot_pass_emails:
debounce_lookup:
validate_emails_disposable:
smtp_service:
smtp_from:
smtp_user:
smtp_pass:
smtp_url:
amqp_allow_replyto_empty_queuename: false
ensure_indexes:
enable_openflow_amqp: true
openflow_amqp_expiration:
amqp_prefetch:
enable_entity_restriction: false
enable_web_tours: true
enable_nodered_tours: false
ping_clients_interval: 10000
license_key:
stripe_api_key:
stripe_api_secret:
NODE_ENV: production
nodered_initial_liveness_delay: 120
multi_tenant: false
update_acl_based_on_groups: true
oidc_access_token_ttl: 480
oidc_authorization_code_ttl: 480
oidc_client_credentials_ttl: 480
oidc_refresh_token_ttl: 20160
oidc_session_ttl: 20160
websocket_package_size: 25000
websocket_max_package_count: 1048576
nodered_images: [{ “name”: “Latest Plain Nodered”, “image”: “openiap/nodered” }]
amqp_force_queue_prefix: false
amqp_force_exchange_prefix: false
amqp_force_sender_has_read: true
amqp_force_sender_has_invoke: false
amqp_force_consumer_has_update: false
amqp_enabled_exchange: false
upload_max_filesize_mb: 25
use_ingress_beta1_syntax: false
namespace: default
allow_personal_nodered: true
auto_create_personal_nodered_group: true
auto_create_personal_noderedapi_group: false
nodered_domain_schema: $nodered_id$.
protocol: http
port: 3000
skip_history_collections: audit,oauthtokens,openrpa_instances,workflow_instances,workitems,dbsize,mailhist
tls_passphrase:
auto_create_users: false
auto_create_domains:
persist_user_impersonation:
aes_secret: who_ever_said_nodejs_isnt_sexy_should_be_shot_and_hanged
tls_crt:
tls_key:
tls_ca:
saml_federation_metadata: http:///issue/FederationMetadata/2007-06/FederationMetadata.xml
saml_issuer: uri:
mongodb_url: mongodb://adminuser:@mongo-nodeport-svc:27017
mongodb_db: admin
mongodb_minpoolsize:
mongodb_maxpoolsize:
amqp_url: amqp://admin:supersecret@rabbitmq
api_ws_url:
nodered_ws_url:
nodered_saml_entrypoint:
domain:
nodered_allow_nodeselector: false
nodered_requests_memory:
nodered_requests_cpu:
nodered_limits_memory:
nodered_limits_cpu:
nodered_liveness_failurethreshold: 5
nodered_liveness_timeoutseconds: 5
noderedcatalogues:
otel_measure_nodeid:
otel_measure_queued_messages:
otel_measure_mongodb_watch:
otel_measure_onlineuser:
enable_analytics:
cache_store_type: memory
cache_store_redis_host:
cache_store_redis_password:
cache_store_ttl_seconds:
cache_store_max:
otel_debug_log: false
otel_servicename:
otel_trace_interval: 5000
otel_metric_interval: 5000
expected_max_roles:
max_recursive_group_depth:
decorate_roles_fetching_all_roles:
roles_cached_in_seconds:
validate_user_form:
auto_hourly_housekeeping: true
housekeeping_update_usage_hourly: false
housekeeping_update_usersize_hourly: true
housekeeping_skip_collections:
workitem_queue_monitoring_enabled:
workitem_queue_monitoring_interval:
stripe_force_vat: false
stripe_force_checkout: false
DEBUG:
HTTP_PROXY:
HTTPS_PROXY:
NO_PROXY:
shorttoken_expires_in:
longtoken_expires_in:
downloadtoken_expires_in:
personalnoderedtoken_expires_in:
wapid_pub:
wapid_key:
wapid_mail:
Mounts:
/var/run/secrets/kubernetes.io/serviceaccount from kube-api-access-kr9b2 (ro)
Conditions:
Type Status
Initialized True
Ready True
ContainersReady True
PodScheduled True
Volumes:
kube-api-access-kr9b2:
Type: Projected (a volume that contains injected data from multiple sources)
TokenExpirationSeconds: 3607
ConfigMapName: kube-root-ca.crt
ConfigMapOptional:
DownwardAPI: true
QoS Class: BestEffort
Node-Selectors:
Tolerations: \node.kubernetes.io/not-ready:NoExecute op=Exists for 300s
\node.kubernetes.io/unreachable:NoExecute op=Exists for 300s
Events:
Type Reason Age From Message
Normal Scheduled 18m default-scheduler Successfully assigned default/api-5bc6c74985-n8pp9 to msappsne004
Normal Pulling 18m kubelet Pulling image “openiap/openflow”
Normal Pulled 18m kubelet Successfully pulled image “openiap/openflow” in 1.101111498s
Normal Created 18m kubelet Created container api
Normal Started 18m kubelet Started container api
signing_crt and signing_key are left out to avoid huge chunks of characters in the description.
NAMESPACE NAME TYPE CLUSTER-IP EXTERNAL-IP PORT(S) AGE
calico-apiserver calico-api ClusterIP 10.110.108.173 443/TCP 14d
calico-system calico-kube-controllers-metrics ClusterIP None 9094/TCP 14d
calico-system calico-typha ClusterIP 10.97.118.146 5473/TCP 14d
default api NodePort 10.109.160.81 3000:30360/TCP 21h
default api-grpc ClusterIP 10.96.13.179 50051/TCP 21h
default kubernetes ClusterIP 10.96.0.1 443/TCP 15d
default mongo-nodeport-svc NodePort 10.100.97.134 27017:32000/TCP 6d2h
default rabbitmq NodePort 10.111.114.112 5672:30861/TCP,80:30104/TCP,15672:32017/TCP 21h
kube-system kube-dns ClusterIP 10.96.0.10 53/UDP,53/TCP,9153/TCP 15d
traefik traefik LoadBalancer 10.99.238.153 80:30008/TCP,443:30376/TCP 27h
And lastly this is the log message when I try to access Openflow via browser:
17:3:29.329 [WebServer ][rateLimiter] Validate for /config
17:3:29.331 [WebServer ][rateLimiter] consumedPoints: 1 remainingPoints: 19
17:3:29.331 [Layer ][handle [as handle_request]] add for /config
17:3:29.333 [LoginProvider ][get_config] Return configuration settings
17:3:31.370 [WebServer ][rateLimiter] Validate for /config
17:3:31.371 [WebServer ][rateLimiter] consumedPoints: 1 remainingPoints: 19
17:3:31.371 [Layer ][handle [as handle_request]] add for /config
17:3:31.372 [LoginProvider ][get_config] Return configuration settings
17:3:31.902 [DBHelper ][GetPushableQueuesWrap] Add pushable queues
17:3:31.905 [DatabaseConnection ][query] query gave 0 results
17:3:33.316 [WebServer ][rateLimiter] Validate for /config
17:3:33.317 [WebServer ][rateLimiter] consumedPoints: 1 remainingPoints: 19
17:3:33.317 [Layer ][handle [as handle_request]] add for /config
17:3:33.318 [LoginProvider ][get_config] Return configuration settings
While looking for some server-side error, I couldn’t find any, making me unable to track what is causing the blank screen to occur. I would like to know if this issue is already known or if there is any specific way to track this kind of issue (or if there is already any solution to it).
Thank you,
Rodolfo