and then I will quickly make an update so the code will auto detect port 50051 as being grpc …
Ok, sorry for spam, i just tested, it will NOT work …
I’m quickly making a fix and publishing a new version
Grpc seems to ignore port:
2024-10-11T09:59:55.654301Z DEBUG openiap_clib: Tracing enabled
2024-10-11T09:59:55.654325Z  INFO openiap_clib: enable_tracing rust_log: "openiap=trace", tracing: "new"
2024-10-11T09:59:55.655218Z  INFO connect_async: openiap_clib: new
2024-10-11T09:59:55.655237Z DEBUG connect_async: openiap_clib: connect_async
2024-10-11T09:59:55.655244Z  INFO connect_async:c_char_to_str: openiap_clib::safe_wrappers: new
2024-10-11T09:59:55.655252Z DEBUG connect_async: openiap_clib: server_address = "grpc://api:50051"
2024-10-11T09:59:55.655257Z  INFO connect_async:safe_wrapper: openiap_clib::safe_wrappers: new
2024-10-11T09:59:55.655263Z TRACE connect_async: openiap_clib: Spawn the async task
2024-10-11T09:59:55.655268Z  INFO connect_async:connect: openiap_client: new
2024-10-11T09:59:55.655631Z  INFO connect_async:connect:connect_async: openiap_client: new
2024-10-11T09:59:55.655677Z  INFO connect_async:connect:connect_async:is_connect_called: openiap_client: new
2024-10-11T09:59:55.655722Z  INFO connect_async:connect:connect_async: openiap_client: Connecting to http://api
2024-10-11T09:59:55.656888Z ERROR connect_async:connect:connect_async: openiap_client: Failed to get config: Connection refused (os error 111)
2024-10-11T09:59:55.658140Z TRACE openiap_clib: Client::Calling callback with result
Unhandled exception. Client+ClientCreationError: Connection failed: ClientError("Failed to connect: transport error")
   at Program.InitializeOpeniapClient() in /app/package/package/main.cs:line 117
   at Program.Main(String[] args) in /app/package/package/main.cs:line 18
   at Program.<Main>(String[] args)
I have now published version 0.0.6 that assumes http with port 50051 is unsecured grpc … and no longer removes the port.
rm -rf bin && dotnet nuget locals all --clear && dotnet add package openiap -s ../openiap/dotnet/packages && dotnet run
Thank you ![]()
Updated to 0.0.6, still connects fine from outside, now also connects from within.
I’ll let it run over the weekend and let’s see what happens ![]()
Sidenote: I’ve removed the manual reconnect code, and changed the retry logic to wait 12000ms at first (increased on subsequent retries) to incorporate the 10s reconnect delay.
Hey @AndrewK, thank you for the feedback on Monday…
We talked about two issues, and I’m pretty sure both are now fixed.
I need to wrap up something, then I will push a new version of the SDK’s
Rust APIs sometimes use 100% CPU after a disconnect
Man, this one was brutal. You suggested it was a Docker-only issue, and for a long time, it actually seemed to be true (it was not, but was much easier to provoke inside Docker).
- I rewrote my .NET test project to run using devContainers and to simulate your test of just calling
PopWorkitemover and over again. I then started disconnecting/reconnecting the network. After 5 to 10 tries, I could trigger the issue, but not debug it. - I added support for running my Rust repo in devContainers. I then added a test to my Rust CLI that loops over non-stop calls to
PopWorkitem. I then started disconnecting/reconnecting the network. After 5 to 10 tries, I could trigger the issue, but debugging it was painful.
After a connection is made, I start two threads (that are not really threads but tasks in the Tokio async framework). This made debugging this so much harder. One for handling incoming messages and one for handling outgoing messages. It turns out that when the 100% CPU usage bug happens, only one of those would be running. That seems to have been fixed now (I cannot reproduce it anymore, even after doing a stupid amount of network disconnects/reconnects), but then I noticed something else. I was seeing the same issue as you reported a while back…
gRPC disconnects after 60 seconds
The 60-second timeout on gRPC but not websockets… again, you were right. It WAS a Docker problem, not something local to you.
I’m constantly swapping between testing toward a local Docker install that either redirects traffic to my dev machine or a test install inside Docker and my Kubernetes cluster in Google Cloud. I noticed I was having the same issue toward Docker, so I tested using my Node.js API and the new Rust API, and BOTH had issues, but only toward Docker… After way too much Googling and ChatGPT talks, I came up with the below… Add this under command on the traefik service in your Docker Compose file, and the problem goes away. I have also added these (commented out) in all the Docker files at the Docker repo.
      # **Timeout settings for gRPC**
      - "--entrypoints.websecure.transport.respondingTimeouts.readTimeout=90000s"
      - "--entrypoints.websecure.transport.respondingTimeouts.writeTimeout=90000s"
      - "--entrypoints.websecure.transport.lifeCycle.requestAcceptGraceTimeout=90000s"
Damn it … after writing this, I saw it only “bumped” up the timeout to 15 minutes … so not completely fixed yet, but seems we are getting closer at least. After reading this, I am now testing using value 0 for all 3
I’m going to stop looking more into this … I cannot for the life of me see where/why connections are being dropped after 15 minutes on Docker, but not Kubernetes.
This would suggest the issue is with Traefik, but when I look at the logs I see
2024-10-19 13:11:59 2024-10-19T11:11:59Z DBG log/log.go:245 > 2024/10/19 11:11:59 reverseproxy.go:663: httputil: ReverseProxy read error during body copy: http2: server sent GOAWAY and closed the connection; LastStreamID=3, ErrCode=NO_ERROR, debug="max_age"
2024-10-19 13:11:59 2024-10-19T11:11:59Z DBG github.com/traefik/traefik/v3/pkg/middlewares/recovery/recovery.go:38 > Request has been aborted [192.168.65.1:47682 - /openiap.FlowService/SetupStream]: net/http: abort Handler middlewareName=traefik-internal-recovery middlewareType=Recovery
This suggests that the Node.js server is gracefully closing the connection and Traefik is just relaying that information to the client. But when I’m testing, I’m pointing my Docker Traefik at the SAME API on the exact same pod. So that would suggest the same server is behaving differently depending on what Traefik instance it’s talking to, which makes no sense to me.
I guess we just have to “live with that” for now and use Kubernetes or WebSockets as an alternative.
I need to remove all my debug code from Rust, clean up some functions, and then I will push a version 0.0.7
I have now pushed version 0.0.7.
I have cut down memory usage by 3/4 (it was crazy high before).
I have improved the retry logic a lot (and made it work the same across websockets and gRPC).
The Rust client now has ALL protocol functions added.
More functions have been mapped to Node.js/Python. .NET is a little behind, but hopefully, I will have mapped all functions from the Rust client to Node.js/Python and .NET at 0.0.8.
I had to “kill” monitoring network usage (this was the thing using a ton of RAM). I’m a little undecided on whether I should keep chasing a solution for this or just accept only monitoring the number of function calls, packages, CPU, and memory usage.
And I found the “solution” … Traefik “broke” gRPC in newer versions, so simply using an older image fixes this.
I don’t know when, but I just tested this version and that seems to work just fine with gRPC without disconnecting every 15th minute.
Simply update image: traefik to image: traefik:v2.10.6 in your Docker Compose file.
Edit: I have had a client connected for 6 hours now, without any disconnects, after downgrading the Traefik image to 2.10.6 … so that is definitely the solution right now. Maybe someone should create an issue on their GitHub, or buy a support subscription to raise awareness around this.
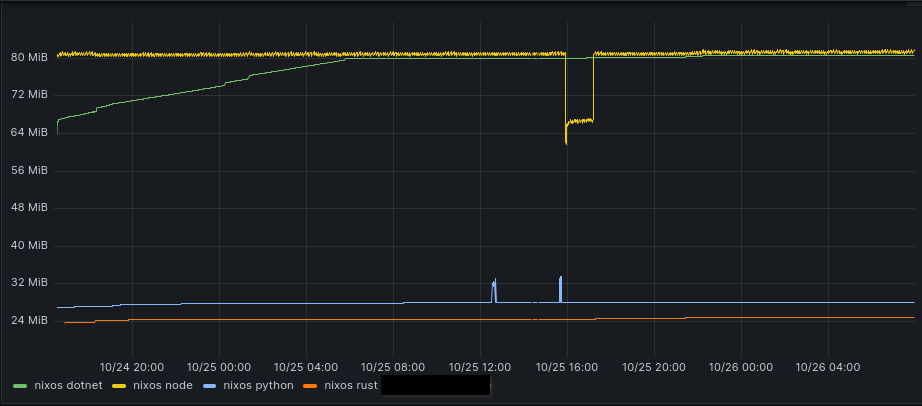
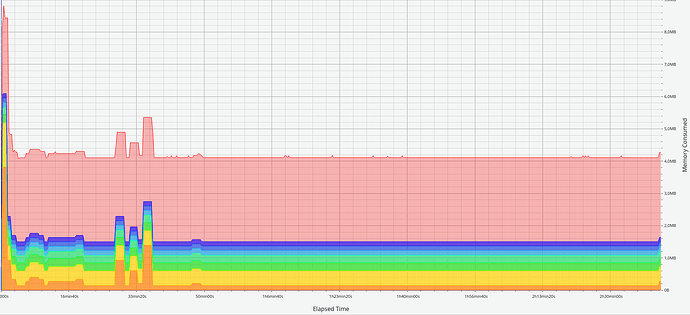
Ok, I’ve been testing a ton of different tools for tracking memory in Rust (that is one thing .NET got right) and I managed to fix the memory leak and decrease the memory usage massively. Here is a Rust client, a Node.js client, a .NET client, and a Python client who is spamming pop workitem requests over 2 days.
I have also managed to get all the missing functions from the API added to all 4 languages. For .NET, I also made a little workaround for serializing results. If you just want the JSON string and can parse that faster yourself, use:
string results = await client.Query<string>("entities", "{}", "{\"name\": 1}");
client.info("Query results: " + results);
But you can also let the client do it for you. So, if you have your own class (in this case Base), you can do something like this:
var results = await client.Query<List<Base>>("entities", "{}", "{\"name\": 1}");
for (int i = 0; i < results.Count; i++)
{
    client.info(results[i]._id + " " + results[i].name);
}
I hope this makes things a little easier to work with for .NET devs. (I’m open to suggestions on something similar for Python and Node.js)
Rust : crates.io / example project / documentation
Node : npmjs.com / example project
dotnet : nuget.org / example project
python : pypi.org / example project
FYI - running on 0.0.13 now.
The memory usage does look better.
The query change required a slight adjustment to specify return types now, but that was just a small adjustment needed.
CPU usage so far looks to be a tiny bit higher than on earlier version (really slight difference), but the memory usage being kept down seems definitely worth it.
I’ll keep it running for a couple of days and report back around the workweek end or when something pops up.
mapping usage
Christ, these past few weeks have been incredibly stressful but also full of learning as I delved into many new tools for tracking memory allocation and usage. I’ve explored dotnet-counters, dotnet-dump, heaptrack, jemalloc, valgrind, and tons of new tricks in gdb.
I personally believe I’m reasonably skilled at tracking and fixing memory leaks in .NET and Node.js, but this was quite a journey.
rust finally rock stable
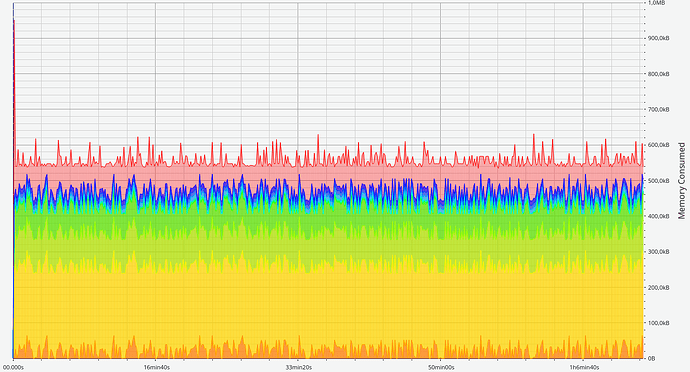
Here is finally the result we were looking for:
500,000 calls to pop workitem, with NO memory increase.
This is from a unit test calling the clib functions, so were at right at the border from rust to the other languages.
I made a few mistakes here and there in the code, but that’s no excuse. Memory issues accumulate, and we need this to work consistently, even when running for months or even years.
- In my Rust client (openiap-client), I was using a oneshot channel to handle results coming back from OpenFlow (similar to how we use TaskCompletionSource in .NET), but I wasn’t releasing it when complete.
- In my C exposing layer (openiap-clib), I wasn’t releasing memory properly.
free_pop_workitem_responsewasn’t freeing all strings and wasn’t handling the release of the actual workitem object. Since our tests weren’t returning a workitem, tracking this issue took much longer. - In the .NET client, I had a significant bug where I wasn’t calling
free_pop_workitem_responseif pop workitem didn’t return a workitem. However, even after fixing that, the above issues were still creating leaks.
dotnet
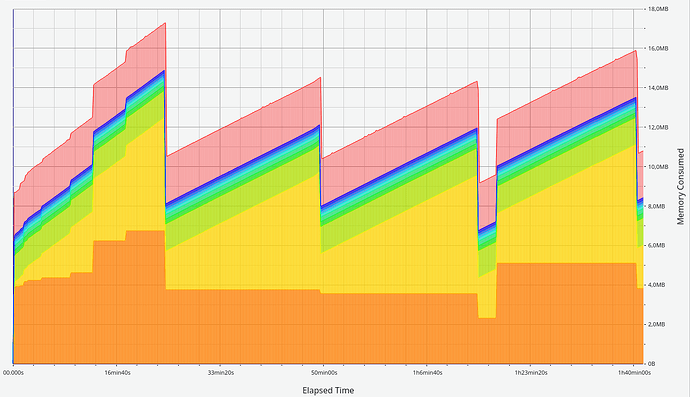
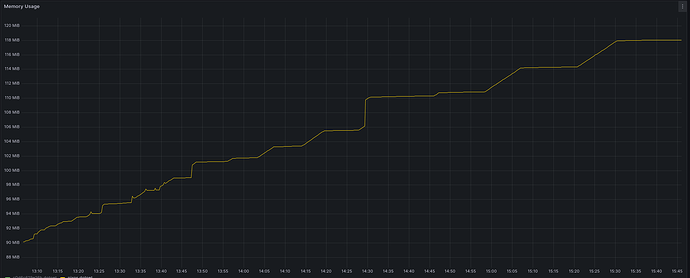
So when firing up my dotnet test code, I was kind of surprised to see this after 1,500,000 pop_workitem request’s from dotnet.
I mean, it’s not a classic memory leak, but I’m not convinced either.
Here is shared+private memory usage
After sooooo many hours of back and forth with chatgpt, and testing different things, i tracked it down to, some issue around how to release memory for some strings, and dotnet not liking when you create a lot of delegates, it now looks more like this.
After calling pop_workitem_async 450 times a second, for more than 2,5 hours, we see this
That looks nice and flat, but …
*insert rage quiting smiley* … for fuck’s sake !!!
Well, I have a ton of good learnings i need to implement all the functions functions in both rust and dotnet.
And i need to keep looking for what is still making the dotnet VM keep allocating more ram, than it’s using.
After waaaayyyy to much time, it’s finally stable
here 12 hours of hammering pop workitem commands to openflow from rust, python and dotnet
Hello, I would like to know about [client. query (collectionname=“users”, query=“{}”)]. May I ask what data this method can query, what the value of collectionname can be, and if there is any documentation or explanation for the SDK method
Hi,
collectionname can be any valid collection name from openflow that the authenticated client has access to. You can check collections under Entities in OpenFlow (the dropdown list is collection names).
The query is any valid mongodb query.
As an example, this would fetch a credential of specified name
        var q = "{\"name\": \"" + credentialsName + "\", \"_type\": \"credential\"}";
        var foundCreds = await openflowClient.Query<string>(collectionname: "openrpa", query: q);
        var foundCredsJson = JsonConvert.DeserializeObject<JObject[]>(foundCreds);
I think there’s something wrong with my setup (this is on 0.0.15):
Were your tests on Docker or K8’s?
Also some other comments that popped up when using the new api:
- Would be good to wrap the dotnet part in a namespace, right now it gets a bit awkward in places. Also paired with #2 below, not all frameworks like having things in the global namespace.
- When loading the package dynamically (not part of the app build), client fails to initialize on
private static string GetLibraryPath(), as the native library is not in the base directory of the current running app. This could be worked around with an optional argument to theClientconstructor for the native library path (or folder it’s in?), that gets passed there (and if there’s nothing, just proceed as normal). - The package size is pretty big due to having all the native versions inside. It’s nothing major, but it does add up.
- Completely agree.
- I’m open to that idea (but I’m not completely sure I understand why the libs could not be found. Do we need to add more search paths/patterns, or is adding an optional path enough?)
- Yeah, I keep circling around that. On one hand, I would love to have some “download the one needed” logic, but I also fear that would create tons of conflicts or security issues in different scenarios. An alternative could be, for one of the popular Rust to Node.js frameworks, they create a separate package per operating system, but I also feel that is messy and it WILL still download all packages. So this really only helps if you KNOW you only need for one or two operating systems.
I’ve done the test on my Linux and Windows machines, and during the last few days, I’ve started 4 dedicated pods in Kubernetes, one for each language. All of them running a function calling pop_workitem as fast as they can.
Here python.
Here nodejs.
Here rust.
And here dotnet.
I did see yours keep increasing, but don’t know what else to add to my testing code to replicate the same pattern as you have. Did you try adding the runtimeconfig.template.json file I suggested? (Long story short, I don’t think that will fix it)
#2 → more search patterns won’t really help I think, as on the library level we do not know what is the specific implementation of the dynamic loading. I’d leave that to the consumer of the package.
For context:
When using it in one of our software stacks on a VM, we needed to inject the native library deep into ProgramFiles before the client would initialize, as when it fetches dynamic dependencies, it ‘installs’ them to a different location.
#3 → maybe a version without the native dependencies included? That coupled with #2 allows for granular control (set up your natives on your own), and cuts down the package size to <1MB. And if someone doesn’t want to bother, they can use the full one. Just food for thought.
Regarding the runtimeconfig, no, I haven’t tried that yet, didn’t have the time unfortunately.
- For Node.js, we can create OS-specific packages containing the binaries for just that OS and then “link” all of them together in a master package with optional dependencies.
- In Python, we can push multiple versions targeting a specific OS, but from what I could find, there is no way to create a master package that links to them all and makes it only download the one for the current OS/architecture.
- In .NET, we can push multiple NuGet packages targeting a specific OS, but there is no way to create a master package that just fetches the packages for the current OS.
I don’t like that. That also means I would need to expand the OpenFlow packages to support multiple platforms and architectures if people could end up targeting only one operating system. For instance, say someone is developing on Windows, so the developer adds the Windows-specific package, but when pushed to OpenFlow, it needs the Linux version, but the developer forgets to update the NuGet reference, then it will fail… that is just messy and will end up with a ton of issues.
So that leaves creating an “auto-download” of the needed binaries. I think that will give issues in certain environments (OpenFlow is also used in air-gapped environments, so that would break). I guess a compromise of that would be to create two versions of the package for all programming languages: a “full” version with all binaries bundled in, and a “slim” version with no binaries that tries downloading if they are not found. I’m not a big fan of that. Yes, that would work now, and even though it adds more work on me and the publish cycle, I could live with that for a while. But where should I host it? Who should pay for the cost of that? What if it goes down? What if we need to move it? What if whatever system I come up with is not flexible enough and needs to be expanded… gah, my head hurts from just thinking about all the things that could go wrong in the future. I really do not like that. At least not right now.
So to help you with your current use case, I added an OpenIAP-Slim NuGet package that does not have the binaries in it, and I have added an optional parameter on the client constructor that allows you to specify the lib folder.
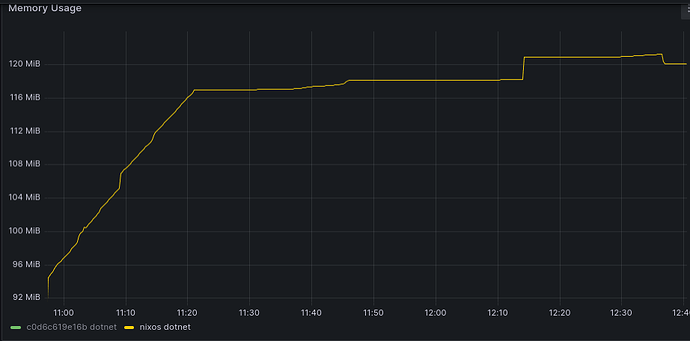
With no changes:
Iteration: 68256, 2024-11-20T09:11:33.3087296+00:00
So it looks like it does stabilize after a while, it just took longer. You were doing the iterations much faster, so I guess it just took a while before GC/JIT/? kicked in? Not sure exactly, but I’d say that it does look like it is stabilizing after a while (with the “after” being potentially related to the runtime environment getting enough allocation data analysis?).
Either way, knocks on wood looks fine to me ![]()
